
Tools based on visual representations of social networks are important to understand network data and convey the result of the analysis. Visualization facilitates qualitative interpretation of network data. This kind of tools helps us to identify key influencers, contents, and to focalize attention on interesting users optimizing our time.
Many experiments having to do with analysing tweets can be found on Kaggle and other websites that take on similar topics. I have tried to aggregate the results of these experiments in a simple web application that shows how different views of the data can be unified in order to get an overall picture that points out interesting connections at a glance.
Kaggle Exploring Tweets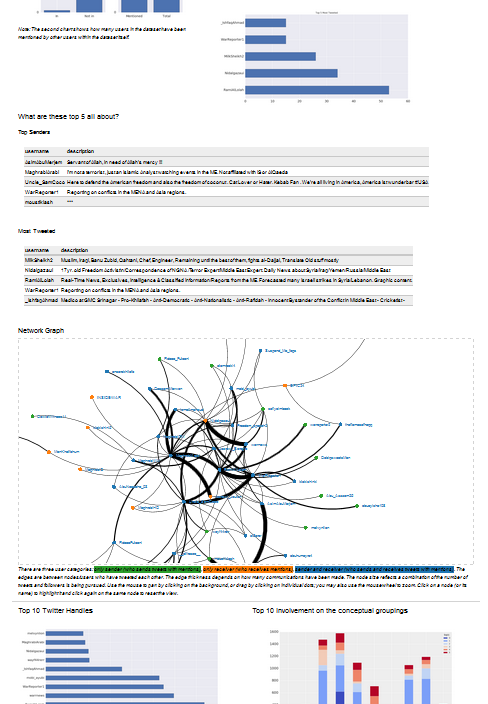
I have also added an interactive map (using D3.js) that is able to highlight relationships among users. By clicking on a node on the map, you can highlight that node with its connections, placing all of the others in the background. The edge thickness depends on how many communications have been made. The node colors represent three user categories (green: only senders, orange: only receivers, blue: senders and receivers).
You can try this web application by following the link:
Exploring TweetsIt is based on an interesting public dataset that is widely used on Kaggle:
dataset with 17K+ tweets from 100+ usersI got this dataset in June of 2016 so it could be not so updated but this is not the objective.
This web application is just an exercise and is an harmonized mixture of many different algorithms. From the point of view of the execution time, the most demanding algorithm is the Latent Dirichlet allocation (LDA) used to extract the top 6 topics/concepts.
Key Features
The interactive visualization provides several important capabilities:
- 🎯 Interactive Network Map: Click on nodes to highlight connections
- 📊 Communication Patterns: Edge thickness shows communication volume
- 🎨 User Categories: Color-coded nodes (green=senders, orange=receivers, blue=both)
- 🔍 Topic Analysis: LDA-based extraction of 6 main topics
- 📈 Real-time Exploration: Smooth interactions with immediate feedback
Technical Implementation
The system combines multiple technologies and algorithms:
Core Technologies
- Python - Data processing and analysis
- D3.js - Interactive network visualization
- LDA - Topic modeling and extraction
- Web Stack - HTML5, CSS3, JavaScript
Performance Notes
- Handles 17K+ tweets efficiently
- Processes 100+ user networks
- LDA algorithm is the most computationally intensive component
- Optimized for real-time user interactions
Dataset Details
The demonstration uses a public dataset with the following characteristics:
- 17,000+ tweets from over 100 users
- Kaggle-sourced data widely used in competitions
- June 2016 collection period
- Focus on social interactions and communication patterns
Enjoy and let me know what you would add.